

TradingView Charts Guide for Nigerian Traders
📊 Master TradingView charts with our thorough guide—learn to navigate, customize, and leverage essential tools and indicators for smarter trading in Nigeria.
Edited By
Ethan Clark
In today's fast-moving trading environment, having access to clear, adaptable charts can really make a difference. Integrating TradingView charts into the Deriv platform offers traders and developers an easy way to tap into powerful charting tools right where they trade.
TradingView is known for its user-friendly interface and a vast range of technical indicators, which makes it a solid choice for analyzing market moves. By embedding these charts in Deriv, users get a smoother experience without jumping between different apps.

This article breaks down exactly what you need to get these charts working on Deriv, from initial setup through to tweaking them just right for your trading style. We'll cover the nuts and bolts as well as some handy tips to ensure you're not just adding charts, but really boosting your trading game.
Whether you're a developer looking to customize your platform or a trader wanting clearer insights, understanding how to properly implement and use TradingView charts in Deriv can save you time and help you make smarter decisions.
Clear, interactive charts aren't just nice to have—they're essential tools that can give you the edge in this fast-paced market.
Let's start by looking at why this integration matters and what benefits it can bring to your trading setup.
Understanding the core tools you’ll be working with is the starting point to successfully integrating TradingView charts on the Deriv platform. This chapter lays that foundation by explaining what TradingView and Deriv bring to the table. Traders and developers alike benefit when they grasp these platforms’ features and strengths before jumping into technical setup and customization.
Getting familiar with TradingView means appreciating why it's become a go-to resource for charting and analysis worldwide. Likewise, knowing the basics of Deriv highlights the range of trading options and user-friendly features that enhance your overall experience. By reviewing both, you build the context for how the two can complement each other—streamlining your workflow and offering a more powerful trading environment.
TradingView is a web-based charting platform known for its rich set of tools tailored for traders and analysts. One standout feature is its extensive library of technical indicators, exceeding a hundred by now, including popular ones like MACD, RSI, and Bollinger Bands. For example, a trader can easily switch from a candlestick chart to a Heikin Ashi view, depending on their strategy, or overlay multiple indicators to spot confirmation signals.
TradingView also supports real-time data from a large variety of markets — stocks, forex, cryptocurrencies, and more — making it a versatile solution regardless of the asset class you’re focusing on. Besides the ready-made tools, it offers Pine Script, a scripting language to build custom indicators or alerts, which is a huge advantage for developers wanting personalized setups.
It’s no secret that TradingView has grown into one of the most popular platforms globally, boasting millions of active users. Traders appreciate the intuitive interface that balances power and simplicity — you don’t need to be a tech whiz to draw trend lines or set up alerts. For the developers, the availability of APIs and the scripting environment means they can extend functionality, automate strategies, and even share builds with a large community.
The platform’s openness fosters an ecosystem where traders, investors, and coders exchange ideas and tools, benefiting from each other’s insights and pushing the boundaries of what a charting platform can do. This dynamic makes TradingView an ideal partner when integrating with platforms like Deriv because it keeps the user’s experience rich and flexible.
Deriv is a comprehensive trading platform that offers both simplicity and variety, catering mainly to beginners and seasoned traders. It provides an accessible gateway to financial markets through a clean interface focused on binary options, CFDs, and forex trading.
Users can execute trades relatively quickly thanks to features like straightforward order placement and real-time pricing. It also offers demo accounts, allowing traders to simulate market conditions without risking real money — a handy feature for testing integrations or new strategies before going live.
Deriv supports an array of trading assets, including forex pairs such as EUR/USD and GBP/USD, commodities like gold and oil, stock indices, and cryptocurrencies. For instance, you can trade the BTC/USD pair or bet on the FTSE 100 index using contracts offered on the platform.
The diversity means traders can adapt their strategies across different markets and instruments without needing separate accounts or platforms. This multichannel access simplifies trading and aligns well with integrating TradingView’s multi-asset chart capabilities, ultimately providing a richer experience for the user.
Understanding the nuts and bolts of TradingView and Deriv sets the stage for a smoother, more effective integration. Once you know what each platform offers, you can better appreciate the synergy when these tools work together.
Integrating TradingView charts on the Deriv platform brings concrete advantages that go beyond just adding visual appeal. For traders and investors, this integration means more than meets the eye—it delivers practical tools and smooth workflows right where they're needed. Combining TradingView’s advanced charting capabilities with Deriv’s trading environment not only ramps up the trader’s ability to analyze markets quickly but also streamlines decision-making processes.
The benefits become clear when you think about the common struggles traders face, like switching between multiple platforms or not having enough customizable tools. This integration cuts those frustrations by providing a unified space with powerful charting features and live trading data. Now, traders can react faster, backed by richer insights from technical indicators and a user-friendly interface.
One of the standout perks of embedding TradingView charts on Deriv is access to a wide range of advanced technical indicators. These aren't your run-of-the-mill tools; they include everything from moving averages and Bollinger Bands to more complex ones like Ichimoku Clouds and Fibonacci Retracements. For example, a trader analyzing forex pairs on Deriv can use TradingView’s RSI (Relative Strength Index) alongside moving averages to get a clearer picture of potential entry or exit points.
What makes this especially valuable is the ability to tailor these indicators to your trading strategy. Adjust parameters, overlay multiple indicators, or combine them with price action to refine your analysis. It shifts you from guessing to trading with confidence, relying on data points you set up yourself.
TradingView offers more than just the common line or bar charts. With customizable chart types like Heikin Ashi, Renko, and Point & Figure, traders can choose the visual style that best fits their approach. For example, Renko charts can filter out noise and focus on price movement trends, which is handy for Deriv users dealing with volatile assets.
Customization also extends to timeframes and chart layouts. You might want a quick 5-minute chart for scalping or a daily chart to spot longer trends. Plus, you can set up multiple chart windows side-by-side within the trading interface, making pattern recognition and cross-market analysis much smoother.
One of the biggest headaches when trading is flipping between charts and the trading platform itself. Integrating TradingView into Deriv removes this extra legwork. Once set up, drawing trendlines or marking support and resistance on the chart updates right alongside your trading interface without delays.
This seamless interface means no missed opportunities due to toggling screens or interface lags. Imagine spotting a breakout on the TradingView chart and instantly placing a trade on Deriv without leaving the same window. It keeps your workflow tight and fluid, which is essential during fast market moves.
Crucial to any trading setup is the freshness of data. The integration ensures TradingView charts on Deriv receive real-time feeds through WebSocket or similar APIs. This real-time update sync reduces latency issues that can cost traders dearly.
For example, a trader watching a cryptocurrency pair will experience the price ticks and chart patterns moving in tandem with their actual trade executions on Deriv. This live sync makes it easier to implement strategies that depend on precise timing, such as scalping or swing trading.
Integrating TradingView with Deriv isn’t just about a prettier interface—it’s about putting powerful, timely insights and trading tools in one place to help traders make smarter moves, faster.
By unlocking advanced charting tools and smoothing out the trading experience, this integration plays a key role in leveling up your market analysis and execution on Deriv.
Before diving into the technical nitty-gritty of adding TradingView charts to the Deriv platform, it's important to lay the groundwork properly. Skipping over prerequisites can lead to headaches down the road, like permission errors, data mismatches, or poor performance. Think of it like assembling a new gadget: having all the parts and instructions ready makes the build smoother.
To connect TradingView's charts with Deriv's platform, you'll need proper access to several APIs. APIs, or Application Programming Interfaces, act as bridges between different software. In this case, you'll need TradingView’s charting library and Deriv’s market data APIs to communicate effectively. These usually require security keys, which are like passwords that prove you’re authorized to use the service. For example, Deriv provides API tokens that give you real-time market prices and account info. Without these keys, your application won't get the data it needs or could face access restrictions. Make sure to store these keys safely and never expose them publicly—think of them as your secret handshake.
Integrating TradingView charts isn’t exactly plug-and-play; it demands some technical chops. Familiarity with JavaScript is essential because TradingView widgets are typically embedded using JS code. Knowing HTML and CSS helps too for designing the chart container and ensuring it fits well within the Deriv interface. Beyond that, understanding how to work with WebSocket or REST APIs for real-time data feeds is crucial. For instance, if you want live price updates or to react to user actions on the chart, you’ll have to write code handling asynchronous events. Developers comfortable with frontend frameworks like React or Vue will find the process smoother but it’s not mandatory. The key takeaway: some coding experience lets you customize and troubleshoot effectively, avoiding a one-size-fits-all mess.
To get started, register for a developer account on the Deriv platform. This step might seem routine, but it’s indispensable because it grants you access to sandbox environments, API keys, and technical documentation. For example, Deriv offers a demo account tailored for testing integrations without using real money. This helps developers experiment without risks. Setting up these accounts early also means you get timely updates on API changes or limits that affect how you build your TradingView integration.
Once you have your developer account, double-check that all the necessary permissions are granted. Deriv requires specific API permissions to allow third-party tools to pull market data or execute trades. Missing out on enabling these can cause your TradingView charts to show stale or no data. Permissions typically cover data read access, streaming market quotes, or trade execution rights if your integration includes placing orders. It’s good practice to verify these settings in your account dashboard to avoid surprises. Permissions act like the keys to different rooms in a house—you want to make sure you’re not locked out of crucial areas.
Proper preparation is the unsung hero behind a smooth integration. Taking time to meet all prerequisites helps avoid time-consuming fixes later and ensures your TradingView charts on Deriv perform reliably and efficiently.
Implementing TradingView charts on the Deriv platform is no walk in the park but breaking down the procedure into clear stages makes it manageable and far less intimidating. This guide lays out the essential steps, helping developers and traders avoid common pitfalls and streamline the integration process. By following these steps, you get a working chart interface that taps into live market data, which is crucial when every second counts in trading.
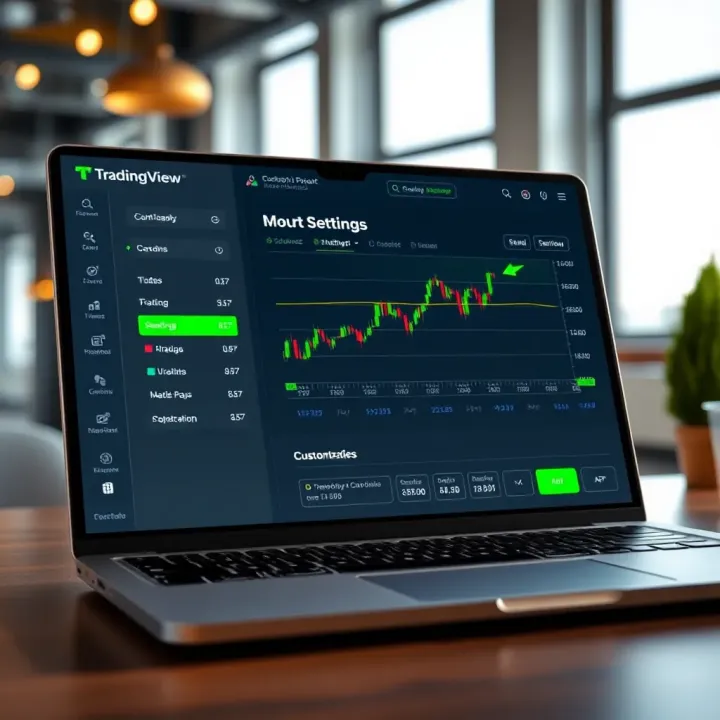
Picking the right TradingView product is the very first brick you lay when integrating charts into Deriv. TradingView offers different tools: the Lightweight Charts library, which is great for simple, fast charts with smaller file sizes, or the full-featured TradingView Charting Library, which is more heavyweight but packs all the bells and whistles like technical indicators, drawing tools, and multiple chart types.
For Deriv's more dynamic trading environment, the Charting Library is usually the better fit as it handles complex data visualization and user interactions better. But, if speed and lightness are priorities, developers might lean toward Lightweight Charts. It all boils down to what level of charting detail and interactivity your project needs.
Once you've decided on the TradingView product, the next move is to get the necessary files ready. For the official TradingView Charting Library, you typically need to request access from TradingView, because they don’t openly host the full library due to licensing. After approval, you'll get a collection of JavaScript and CSS files.
Alternatively, Lightweight Charts is available via npm or CDN, and it's a breeze to include it with a simple tag or an npm install. Integrating these files carefully ensures your charts load correctly and behave as intended within Deriv’s environment.
Feeding live market data to TradingView charts demands a solid connection setup. Deriv provides APIs via HTTP REST or WebSocket. WebSocket is typically preferred because it supports continuous, real-time data streams without the need to poll for updates—which is perfect for live trading.
Setting up the API involves authenticating your connection using keys, subscribing to the correct market symbols, and handling incoming data packets properly. For example, subscribing to tick updates on the Deriv platform will allow your TradingView chart to reflect price changes instantaneously.
Just receiving data isn’t enough—you've gotta parse and push it to the TradingView library correctly. This means converting Deriv’s tick or candle data into the format expected by TradingView, usually arrays of timestamp, open, high, low, close, and volume values.
To prevent lag or glitches, buffering the data and managing network hiccups smartly is crucial. For instance, caching the most recent candles in memory ensures the chart remains responsive even if a small blip in connectivity happens.
With data flow setup, embedding the TradingView chart within Deriv’s UI involves writing clean HTML and JavaScript. Usually, you create a container `` element where the chart will render, then instantiate the TradingView widget or charting library inside it.
JavaScript configuration objects define the chart options—timeframe, style, indicators—and handle callbacks for user interactions. Making sure this code hooks into Deriv’s front-end framework smoothly is key, so the chart feels like a native part of the trading platform.
Traders use all sorts of devices, so making sure TradingView charts scale correctly on every screen size is important. Responsive design means the chart adjusts fluidly to changes in window size without losing clarity or functionality.
Using CSS flexbox or grid layouts around the chart container helps here, combined with JavaScript listeners that refresh or resize the chart when the window changes. This way, whether you’re trading on a desktop or a mobile device, the charts stay clear and easy to use.
Integrating TradingView charts into Deriv is more than plug-and-play; careful attention to product choice, data feed management, and UI embedding ensures a smooth experience that traders will rely on in fast-moving markets.
Customizing TradingView charts within the Deriv platform is key for tailoring your trading experience to better fit your strategy and preferences. While the default charts come packed with features, tweaking aspects like appearance and adding your favorite indicators can make a world of difference. A chart that’s easy on the eyes and packed with relevant info helps traders make quicker, smarter calls. Whether you're a newbie or a seasoned trader, these customization options can clear up clutter and spotlight the signals you really care about.
Themes and colors play a critical role in how you interact with charts day in and day out. For instance, if you’re trading late into the night, a dark theme reduces eye strain and keeps you alert longer. Conversely, some traders prefer lighter themes because they find it easier to distinguish colors and lines. On TradingView integrated with Deriv, switching themes is a breeze and can be done instantly to match changing light conditions or moods.
Choosing the right colors also helps highlight important chart elements like support and resistance lines, candlesticks, or volume bars. Bright red and green colors are common for candlesticks indicating bearish and bullish days, but you might want to soften those if you find them too glaring. Custom color palettes also benefit traders who are color-blind or have color preference to avoid misreading signals.
Layout options allow you to organize your charts and tools for maximum efficiency. Do you prefer seeing several timeframes side-by-side or want a single large chart with overlays? TradingView lets you change the layout within Deriv, so you can study different angles without flipping through tabs. You can also decide what toolbars or panes to display — hiding less-used ones declutters the screen.
For example, you could have a split layout on one side showing a 5-minute candlestick chart and on the other a daily line chart with volume indicators beneath each. This customization helps keep everything visible for quick analysis and avoids bouncing around multiple screens.
When it comes to popular technical indicators, TradingView offers a buffet of options integrated into Deriv. Moving averages, RSI (Relative Strength Index), MACD (Moving Average Convergence Divergence) are staples that most traders rely on. Adding these indicators directly on your charts helps you spot trends early or gauge market momentum without pulling data from other sources.
For instance, setting a 50-period moving average over your candle chart can quickly show if the current price is above or below the trendline — a critical signal for many strategies. Pairing RSI with MACD on the same chart can illuminate areas of overbought or oversold conditions, helping you decide when to enter or exit trades.
User annotations give you the freedom to mark up charts with your own comments, lines, and shapes. This capability is incredibly useful for noting important events like earnings calls, economic news releases, or personal trading observations. Imagine you spot a double bottom pattern forming; you can draw it directly on the chart and add a reminder for yourself to watch for a breakout.
Annotations also aid collaboration if you share your charts with others, as they make your thought process clear without extra explanation. With TradingView’s library on Deriv, these drawings are saved alongside your chart setup, so they're always ready when you log back in.
Fine-tuning your TradingView charts in Deriv not only boosts clarity but also arms you with personalized insights. A well-customized chart turns raw data into a visual story that fits your trading style.
By making these adjustments and additions, you ensure your trading environment matches your workflow, minimizes errors, and enhances your overall efficiency.
When embedding TradingView charts into the Deriv platform, safeguarding data security and respecting user privacy isn't just a good idea—it's an absolute necessity. Trading platforms handle sensitive financial data and personal information, making security breaches potentially costly both in terms of money and trust. Addressing these concerns early ensures users feel confident and that the platform complies with legal requirements.
By protecting data effectively, you limit risks such as unauthorized access, identity theft, and manipulation of financial data. This section zooms in on two main pillars: protecting API keys and ensuring compliance with data regulations, both critical to a solid and trustworthy integration.
API keys are like the keys to your trading kingdom—they grant access to real-time data and vital functions. If they fall into the wrong hands, it could lead to unauthorized trades or data leaks. Best practices for managing these credentials start with limiting where and how keys are stored and used.
Never hard-code keys in front-end code. Store them in secure server-side environments, keeping them out of reach from anyone inspecting browser code.
Use environment variables to manage keys instead of plaintext files or source code repositories.
Implement access controls. Restrict which IP addresses or services can use the keys.
Rotate keys regularly. Updating them reduces the damage window if a key is compromised.
Monitor usage for unusual activity that might hint at theft or misuse.
For example, if you're integrating TradingView's data via their API, keep your API key safely stored with your backend code, and pipe data to the client side through your secured servers. This way, even if someone uses developer tools on their browser, they won’t stumble upon your keys.
Pro Tip: Treat API keys like passwords. If exposed, they can cause serious harm.
Different countries have varying rules about handling user data, especially financial information. Nigeria follows data protection laws like the Nigeria Data Protection Regulation (NDPR), which sets standards for how personal data should be collected, stored, and processed.
For any Deriv integration, you must ensure that user data coming through TradingView charts isn't mishandled. This means:
Collecting only necessary data. Don’t gather more info than you absolutely need.
Ensuring data encryption during transfer and at rest. Use HTTPS for all connections.
Obtaining explicit consent from users before processing their personal data.
Providing transparent information about how their data is used and stored.
Designing for user control, allowing them to access, correct, or delete their data.
In practice, this means when users link their Deriv account to TradingView charts or third-party data services, the platform should clearly notify them about what’s shared and how it’s protected. Additionally, the platform’s infrastructure must comply with encryption and storage standards, avoiding any careless handling that might expose data.
Remember, beyond legal compliance, users appreciate honesty and transparency about their data, which builds trust and encourages platform loyalty.
Handling data security and privacy doesn’t just tick boxes; it's about creating a resilient, trustworthy trading environment where users can focus on their trades without second-guessing their safety. Following these best practices keeps your integration solid and users confident.
When integrating TradingView charts on the Deriv platform, encountering hiccups is almost inevitable. Troubleshooting common issues is vital because it helps traders and developers keep the charts reliable and responsive, ensuring no trading opportunities slip through the cracks. Addressing problems early avoids frustration and keeps decision-making sharp with real-time data at your fingertips. In particular, resolving chart loading problems and syncing errors swiftly can mean the difference between smooth trades and missed signals.
The first step when charts refuse to load properly is to isolate the problem. Start by checking your internet connection and server status on both TradingView and Deriv platforms. A poor connection or downtime can be the root cause. Next, clear your browser cache or try loading the chart in a different browser. Sometimes, corrupted cache files interfere with script loading. Inspect the console logs (usually accessed via developer tools in your browser) for any JavaScript errors related to TradingView’s widget or API calls. These error messages can pinpoint whether the issue is with the TradingView library, API key authentication, or even the way data feeds are set up.
Chart loading issues often stem from one of the following:
API Key Problems: Invalid or expired TradingView API keys will prevent charts from rendering.
Delayed Data Feeds: If Deriv's data feed is slow or disconnected, the chart may not update.
Resource Limitations: Heavy scripts or numerous charts running simultaneously can cause browser overload, leading to failures in loading.
Cross-Origin Restrictions: Browsers blocking requests due to CORS policy can stop the chart from fetching necessary data.
By systematically checking each cause, developers can eliminate blockers and get the charts functioning promptly.
Network speed and stability play a big role in how smoothly charts update in real time. It helps to use a wired connection when possible or ensure a strong, low-interference Wi-Fi signal. Using content delivery networks (CDNs) or close server locations for hosting data endpoints reduce latency. Additionally, throttling background apps or services consuming bandwidth can improve responsiveness. Developers might implement retry mechanisms in the code that automatically reconnects to the data feed after a brief interruption, alleviating temporary network glitches.
For traders, a chart that's a few seconds behind can lead to costly mistakes. To keep updates truly real-time, it's important to:
Use WebSocket connections instead of REST APIs where feasible, as WebSockets provide continuous data streams without polling overhead.
Optimize data payloads by sending only necessary information to reduce transmission time.
Implement efficient rendering strategies in the TradingView widget settings to avoid redraw delays.
Continuous synchronization ensures that your chart data reflects the market at that very moment, which is absolutely essential for time-sensitive trades.
By following these steps, you ensure that your TradingView charts on Deriv remain responsive, accurate, and ready for action whenever the market moves.
When integrating TradingView charts into the Deriv platform, performance optimization isn’t just a nice-to-have — it’s essential. Traders expect really snappy and smooth chart interactions because delays can throw off decision-making in fast-moving markets. Poor load times or jerky updates can lead to missed opportunities or simply frustrate users, making them less likely to stick with your platform.
Performance tweaks help the whole trading experience feel more natural and efficient. Whether it’s cutting down how long the chart takes to appear or making sure price ticks register instantly, these improvements keep users engaged and confident.
Efficient resource loading is key to getting your TradingView charts visible and ready fast. This means optimizing the way scripts, stylesheets, and graphics load on the page. For instance, you can load only the essential TradingView libraries at first and then pull in additional features like extra indicators or drawing tools asynchronously after the main chart appears. This "lazy loading" approach keeps the initial fetch small, speeding up first paint times.
Minimizing unused code and compressing JavaScript files before deployment also make a big difference. Tools like Webpack or Rollup can bundle these resources neatly, removing bloat that slows down the browser. Moreover, serving these assets via a fast content delivery network (CDN) cuts down latency, especially for users in Nigeria who might face slower internet speeds.
Caching strategies further help by storing key resources locally in the user's browser. When the trader returns or interacts repeatedly, cached files can load instantly without hammering the server. Smart cache control headers, such as setting appropriate expiration dates, ensure charts stay current without forcing unnecessary reloads.
A good practice is to cache static assets like JavaScript libraries or icon sets while keeping real-time data and dynamic content fresh by pulling them live. This balance slashes load times without sacrificing accuracy, which is crucial when tracking market movements.
A fast-loading chart isn’t just a convenience—it's a necessity for traders working on tight windows where milliseconds matter.
As more traders rely on smartphones and tablets, making TradingView charts mobile-friendly on Deriv is non-negotiable. Responsive layouts adapt the chart's design fluidly across screen sizes. Instead of squishing or cutting off elements, a well-coded responsive design rearranges and resizes components like toolbars, price scales, and indicators so they remain readable and interactive on any device.
CSS frameworks like Flexbox or Grid are great tools here, plus media queries to adjust font sizes and padding for smaller screens. Avoid fixed pixel widths or absolute positions that break layouts when the viewport shrinks. Instead, use percentages and relative units to create a flexible and user-friendly interface.
For example, switching to a tabbed layout on mobile can hide less critical options but keep them accessible without cluttering the tiny screen. This gives a neat, professional feel that traders appreciate when they're on the move.
Touch interactions round out the mobile experience. Desktop interactions like hover-based tooltips don’t translate well to touch devices, so implementing intuitive gestures like pinch-to-zoom, swipe for timeframes, or tap for indicator details are essential.
Make sure interactive elements respond quickly to touch without lag and provide visual feedback. Also, avoid tiny buttons that are hard to tap. Adequate spacing ensures the trader can operate the chart without frustration.
Testing these touch features thoroughly on actual devices used locally—like Android phones popular in Nigeria—is important, as emulators might not catch all quirks.
By focusing on responsive layouts and smooth touch controls, you create a trading experience that’s as capable on a smartphone as it is on a desktop, helping traders stay connected anytime, anywhere.
Keeping your TradingView integration on the Deriv platform up-to-date and running smoothly is not just a nice-to-have; it's essential for maintaining a reliable trading environment. The financial markets don’t wait, and neither should your tools. Regular upgrades and a solid maintenance plan reduce downtime, improve performance, and ensure compatibility with evolving data feeds or platform updates.
Let’s break down some key considerations and practical strategies to help you stay ahead.
TradingView frequently rolls out updates to its charting library and widgets, adding new features or fixing bugs. Staying in the loop with these releases is crucial. For instance, if you ignore an update that patches a security flaw or a latency issue, your Deriv platform could run into unexpected errors or even expose users to risks.
A good practice is to subscribe to TradingView's official developer newsletters or monitor their GitHub repositories when open-source components are involved. Set reminders to check for updates every few weeks, and test new versions in a sandbox before pushing to production. This way, you maintain a balance between innovation and stability.
While updates bring improvements, they can sometimes break existing functions if backward compatibility isn't carefully managed. This means your previously working chart features might suddenly stop functioning after an upgrade.
To prevent this, ensure that new TradingView releases explicitly mention support for older API calls used in your integration. If not, you might need to adjust your implementation to accommodate changes. Keeping a version history and change log handy can save you a lot of headaches, especially when debugging unexpected behavior after an update.
No integration remains flawless if left unchecked. Routine testing helps catch issues before they impact traders. Implement end-to-end tests that simulate real trading scenarios on Deriv’s platform using TradingView charts. This can include loading charts, applying indicators, and checking data feed accuracy.
Automated testing tools, combined with manual spot checks, provide a layered safety net. For example, you might schedule test runs after every TradingView update or Deriv platform patch, ensuring nothing breaks silently.
API endpoints or data formats can change without much warning, whether on TradingView’s side or Deriv’s data feeds. Ignoring these shifts could cause charts to malfunction or data delays, directly affecting trading decisions.
Maintain an agile approach by regularly reviewing API documentation and setting up alerts for deprecation notices. When changes occur, prioritize updating your integration scripts promptly. Also, designing your code to be modular and flexible can allow swift swaps of affected components without overhauling your entire system.
Staying proactive with upgrades and maintenance isn't just about fixing issues; it's about building trust with your users and ensuring they have a dependable trading tool day in, day out.
In summary, success with integrating TradingView charts into Deriv hinges not just on the initial setup but on ongoing attentiveness. Keep your components current, test regularly, and prepare for API evolution to keep your charts sharp and your traders happy.
Wrapping up the integration of TradingView charts into the Deriv platform is more than just ticking boxes—it’s about making sure the tools brought together really serve their purpose to enhance the trading experience. A solid conclusion ties together what’s been learned and applied, offering a clear sense of direction for developers and traders alike. This section highlights the tangible benefits and critical takeaways, ensuring users know not just how to integrate the charts but how to keep them working smoothly and effectively.
The integration process is quite straightforward but requires attention to detail. It begins with selecting the right TradingView widget or library that fits the Deriv platform’s technical setup, followed by configuring the connection to Deriv’s live data streams through APIs—most often WebSocket or REST. Embedding the chart means blending HTML and JavaScript seamlessly, so the charts respond well regardless of screen size. Customization is the next crucial step—adjusting themes and indicators to match the trader’s style or the platform’s branding.
Each of these steps serves a practical function: choosing the proper widget ensures compatibility, linking to Deriv data provides live updates, and customization boosts usability. Knowing this sequence helps avoid common pitfalls like slow chart loads or data delays. For example, caching strategies can significantly cut down load times, making the whole setup feel snappier.
To get the best out of TradingView on Deriv, regular testing and maintenance can’t be overlooked. Developers should keep an eye on API changes from both TradingView and Deriv, as these can quietly break features if left unchecked. Using version control and continuously monitoring performance metrics will catch issues early.
Traders, on their part, should explore customizing indicators and layouts—not just sticking with defaults. This helps tailor the charting tools to trading styles, improving decision-making speed. For instance, a day trader might find shorter timeframes and volume indicators more valuable than longer-term setups.
The financial and trading tech fields move fast, so staying updated is key. Developers should regularly check release notes from TradingView and Deriv’s developer portals. Online forums such as Stack Overflow or GitHub discussions often reveal fixes and tricks that official docs don’t cover.
Traders benefit from training materials ranging from webinars, tutorials on using TradingView’s features, to courses that explain how real-time data influences trading decisions. Keeping a habit of learning new charting techniques or market analysis strategies can turn a good chart setup into a real edge.
Keeping your integration clean and up-to-date isn’t a one-and-done task—it’s a continuous process that pays off by reducing headaches and boosting confidence during trading.
By recognizing these aspects—clear steps, practical recommendations, and ongoing learning—users can make the most out of embedding TradingView charts on Deriv. It’s about smooth execution combined with smart upkeep and growing expertise.
📊 Master TradingView charts with our thorough guide—learn to navigate, customize, and leverage essential tools and indicators for smarter trading in Nigeria.
Explore how Nigerian traders can seamlessly use Deriv on TradingView 📈. Get practical tips, learn key features, and navigate local regulations effectively.

📊 Discover how to navigate and customize TradingView.com charts for precise market analysis. Learn to use key tools and indicators for smarter trading decisions in Nigeria and beyond.

Explore how Nigerian traders can use TradingView on Deriv.com 📈. Learn setup, key tools, and smart analysis for better trading decisions in Nigeria 🇳🇬.
Based on 10 reviews