

Key Chart Patterns Every Trader Should Know
📈 Learn to spot 7 key chart patterns like head & shoulders, triangles, and flags. Boost your trading skills with practical tips for smarter market moves.
Edited By
Michael Thompson
Chart patterns are a vital tool for traders and investors looking to navigate both Nigerian and global financial markets. These shapes and formations on price charts help to forecast market movements, revealing the psychology behind buyer and seller behaviour. Understanding chart patterns grants you an edge, especially in volatile markets like the Nigerian Stock Exchange (NGX) or the FX market where reactions to news and policy shifts can be swift.
Trading decisions often hinge on recognising patterns that signal trend continuation, reversal, or consolidation. For example, a head and shoulders pattern usually warns that an uptrend is about to reverse, while a flag pattern suggests a brief pause before the trend continues. These signals alert you on when to enter or exit trades, helping to manage risk and optimise profits.
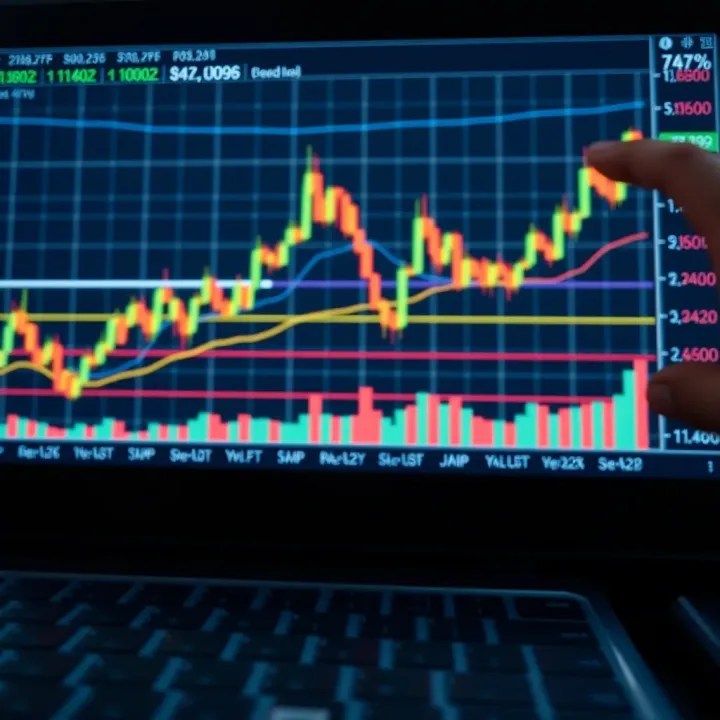
Using chart patterns effectively requires more than spotting shapes; it demands recognising volume changes, support and resistance levels, and confirming signals from other technical indicators. A volume spike during a breakout from a triangle pattern, for instance, strengthens the likelihood that the new trend is valid.
PDF resources give you practical tools to reinforce this knowledge. Downloadable guides containing detailed illustrations of patterns, historical examples from Nigerian equities or forex pairs like USD/NGN, and step-by-step interpretation instructions can serve as ready references during live market sessions. Such materials also often include exercises to test your pattern recognition, helping you train your eyes faster.
Mastering chart patterns is less about memorising every shape and more about understanding what markets are signalling beneath the price moves. Concrete knowledge paired with practical resources puts your trading skills on solid ground.
To get started, focus on these common patterns:
Reversal patterns: Head and Shoulders, Double Top/Bottom, and Triple Top/Bottom
Continuation patterns: Flags, Pennants, and Triangles
Bilateral patterns: Symmetrical Triangles and Rectangles
Studying these with real market charts and PDF guides will sharpen your ability to read price actions and anticipate key moves in the market. Traders who skilfully apply these patterns often find they can trade more confidently even amid Nigeria's dynamic market conditions.
Next, we'll explore each pattern type in detail, giving you practical insights and Nigerian market examples to deepen your understanding.
Chart patterns serve as visual signals that reveal market sentiment and potential price movements. In trading, recognising these patterns can give investors an edge, especially amid volatile market conditions. For example, spotting a 'head and shoulders' pattern early can alert you to a possible trend reversal, allowing you to adjust your positions to avoid losses or secure profits.
Chart patterns combine historical price data into shapes that reflect the balance of supply and demand. They distil complex market behaviour into interpretable forms, making it easier for traders to decide when to buy, hold, or sell. This guide focuses on patterns relevant to everyday Nigerian traders and investors, helping you make decisions anchored in market psychology rather than guesswork.
At their core, chart patterns represent the tug of war between buyers and sellers. These formations show periods of accumulation, distribution, or consolidation in price. Take the example of a 'double top' pattern—it indicates two failed attempts to break a price ceiling, signalling sellers are gaining control. Conversely, a 'triangle' pattern often suggests a temporary pause before the price continues in the previous direction.
By reading these patterns, traders gauge market momentum and potential turning points. This translates into actionable strategies without relying solely on news or indicators. It’s like reading body language in a negotiation; the market ‘tells’ you what it might do next, if you know how to watch.
In Nigeria's dynamic market environment—where factors like currency fluctuations, oil prices, and political events impact trades—chart patterns help cut through the noise. For instance, during periods when the naira weakens sharply, recognising consolidation patterns can signal stability before a breakout move.
Moreover, local traders often face limited access to sophisticated analysis tools. Mastering chart patterns provides a practical way to analyse stocks listed on the Nigerian Exchange (NGX) or commodities like crude oil. It also fits well with growing digital platforms like Piggyvest or Kuda, where users actively trade with limited time for in-depth research.
Familiarity with common patterns improves timing decisions, reduces emotional trades, and increases confidence. So, by understanding chart patterns, Nigerian traders sharpen their edge and position themselves well in both local and global markets.
Recognising chart patterns is a skill that turns raw price data into strategic insight, crucial for navigating Nigeria's fast-moving financial markets.
Chart patterns serve as essential tools for traders, investors, and analysts aiming to anticipate potential price movements in the market. In the Nigerian trading scene, with the Nigeria Exchange (NGX) playing a key role, understanding these patterns enhances decision-making and risk management. Recognising patterns like reversals or continuations can help you time your entries and exits more precisely, potentially improving returns.

Reversal patterns signal a likely change in the current trend, alerting that an uptrend may switch to a downtrend, or vice versa. The Head and Shoulders pattern is a popular reversal indicator. It forms when a peak (the head) is flanked by two lower highs (the shoulders). For example, a stock on NGX climbing steadily before forming this shape might be hinting at a decline ahead. The inverse head and shoulders pattern suggests a bullish reversal after a downtrend.
The Double Top and Double Bottom patterns appear when prices test the same support or resistance level twice but fail to break through decisively. A double top usually forecasts a bearish turn, while a double bottom hints at bullish momentum. Nigerian traders often spot these patterns around corporates’ earnings announcements or macroeconomic shifts.
Continuations tell us that the existing trend is likely to persist after a short pause. Flags resemble small rectangles that slope against the prevailing trend, often seen after strong price movements. For instance, after a sharp ascent, a flag pattern may form as consolidation before the uptrend resumes.
Pennants look like small symmetrical triangles and form when the price tightens within converging trend lines, usually following a big move. In both flags and pennants, volume typically decreases during the formation and picks up when the trend continues.
Triangles, whether ascending, descending, or symmetrical, signal that the market is gathering momentum for a break. An ascending triangle, with a flat top and rising bottom, often points to an upward breakout. Nigerian investors watching NGX blue-chip stocks may observe these formations around key economic reports.
Candlestick charts shed light on market sentiment through the shape and size of individual candles. Here are three essential candlestick patterns every trader should know:
Doji: A doji forms when the opening and closing price are nearly equal, producing a small body with long wicks. This suggests indecision between buyers and sellers. In Nigerian markets, spotting a doji after an extended price move may warn that the trend is losing strength and a reversal could come next.
Hammer: The hammer candlestick has a small body at the top and a long lower wick, resembling a hammer. It signals that sellers pushed the price down significantly during trading, but buyers regained control by close. This often marks a potential bullish reversal after a downtrend. For example, if a Nigerian stock has been falling and you catch a hammer pattern, it might be time to watch for a rebound.
Engulfing: The engulfing pattern consists of two candles where the second candle's body fully covers the first. In a bullish engulfing, a smaller red candle is followed by a larger green candle, signalling strong buying pressure and possible upward move. Conversely, a bearish engulfing shows a larger red candle overtaking a green one, indicating sellers overpowering buyers. Traders in Nigeria frequently use engulfing patterns to time entries on NGX-listed shares.
Mastering these common chart patterns and their meanings equips you with foresight about market moves. They blend price action and psychology, helping you make smarter trades in Nigerian and global markets.
Learning chart patterns through PDFs offers a structured and flexible way to master trading techniques. Unlike videos or live sessions, PDFs allow Nigerian traders and investors to study detailed diagrams, definitions, and examples at their own pace, even offline. This flexibility is handy in a market where internet access can be inconsistent, especially outside major cities.
PDF guides provide a reliable reference you can consult repeatedly. They often break down complex patterns like the Head and Shoulders or Double Bottom into clear visuals and simple language. For example, a well-designed PDF might include annotated charts from the Nigerian Stock Exchange (NGX) showing actual occurrences of these patterns in popular stocks like MTN Nigeria or Dangote Cement.
Another plus is portability. Traders can load PDFs on their phones or tablets and review them during downtime—say, while waiting for a danfo or during downtime at the barbing salon. This constant exposure sharpens pattern recognition skills over time.
PDFs also tend to consolidate knowledge efficiently, combining theory, practical tips, and quizzes to test understanding. Unlike scattered articles online, these guides serve as comprehensive manuals, reducing the risk of misunderstanding or missing key details.
Finding authentic and updated PDFs can be tricky, but certain sources stand out. The Central Bank of Nigeria’s (CBN) financial education materials and the Nigeria Stock Exchange’s official website occasionally provide free guides tailored to local market conditions. Financial education platforms like Investopedia and TradingView offer downloadable PDFs, though they focus on global patterns that you can adapt for the Nigerian market.
For more localised content, fintech apps such as Trove and Bamboo sometimes share educational resources including PDFs suitable for beginners and intermediate traders. Meanwhile, financial blogs run by Nigerian market analysts often provide free downloadable guides. Always check the publication date to ensure relevance, as market dynamics evolve.
Consistently practicing with quality PDF resources helps develop a professional’s ability to spot patterns early, potentially translating into better timing and higher profits in local trades.
In summary, chart pattern PDFs are invaluable for Nigerian traders keen to deepen their technical analysis skills. They offer a low-cost, accessible way to build confidence in reading market signals. Keep an eye on official Nigerian financial institutions and reputable platforms for the best learning materials tailored to your trading environment.
Chart patterns offer Nigerian traders a solid way to predict market moves based on historic price behaviour. Applying these patterns within the Nigerian financial markets—especially the Nigerian Stock Exchange (NGX)—helps investors spot trends and potential reversals, improving decision-making amid naira's fluctuating value and local economic conditions.
Working with NGX data means adapting chart pattern analysis to a market influenced by unique local dynamics like foreign portfolio flows, government policies, and sector-specific performance. For example, recognising a double bottom pattern on stocks of companies like Dangote Cement or Zenith Bank might signal a price rebound after a period of consolidation.
Such patterns, when confirmed with volume data from NGX, can guide traders on entry and exit points. However, Nigerian markets sometimes experience volatility spikes due to policy shifts or currency fluctuations, causing false breakouts. Therefore, it’s essential for traders to combine pattern signals with fundamental news and volume analysis to avoid losing points on misleading signals.
Successful traders on NGX pay close attention to patterns supported by real trading volumes and news about sectors like oil, banking, or telecommunications.
The rise of Nigerian fintech platforms such as Kuda, OPay, and Bamboo now allows traders to integrate chart pattern recognition directly into their mobile trading apps. Many fintech apps come with built-in charts and indicators that help users identify patterns without needing separate services.
For instance, using Bamboo’s interactive charts, an investor can track pennants or flags in real time, adjusting trades swiftly around earnings announcements or economic data releases. This immediacy is crucial in Nigeria’s fast-moving markets, where trading opportunities can vanish within hours due to news or naira value shifts.
Besides, some fintechs provide educational resources and PDF guides on chart patterns, which aid both budding and seasoned traders to sharpen their skills systematically. Nigerian traders benefit from these localised resources tailored to national stocks and forex pairs influenced by CBN policies and global oil prices.
In short, combining traditional chart pattern techniques with modern fintech tools lets Nigerian traders navigate market complexities better. It balances technical analysis with accessible, up-to-date data access, giving you a competitive edge in NGX and beyond.
Trading using chart patterns can be rewarding, but it also carries risks if you fall into common traps. This section highlights key mistakes Nigerian traders frequently make and practical tips to improve accuracy and confidence when applying pattern analysis.
False breakouts often trick traders into thinking a price move will continue, only for it to reverse shortly after. This frequently happens with popular patterns like triangles or head and shoulders. For example, on the Nigerian Stock Exchange (NGX), there have been cases where a breakout above resistance on a stock like Dangote Cement appeared strong but quickly crumbled due to thin market participation or weak volume.
To avoid this, always confirm breakouts with trading volume. A genuine breakout typically accompanies a significant surge in volume, signalling real buying or selling interest. Relying solely on price movements without volume confirmation can lead to losses. Also, beware of whipsaws—sharp price moves that pull traders into positions just to reverse unexpectedly.
Another mistake is misreading patterns by ignoring the broader market context. If the overall market is weak, a bullish pattern is less likely to succeed. Therefore, it’s wise to combine chart patterns with general market trends or macroeconomic factors affecting Nigerian stocks like currency fluctuations or fuel subsidy news.
Knowing when to enter or exit a trade based on chart patterns is critical. Acting too early can trap you if the pattern hasn’t fully formed. For instance, placing buy orders at the left shoulder of a head and shoulders pattern almost always results in poor entry because the reversal isn’t confirmed.
Wait for clear confirmation signals before making your move. This might mean waiting for a candle close outside the pattern boundary or the retesting of a breakout level. For Nigerian traders using fintech platforms like Kuda or OPay, setting alerts for these confirmation points can help avoid premature trading.
In addition, manage your trade size and use stop-loss orders effectively to protect against sudden reversals. A good stop-loss level is just beyond the pattern’s invalidation point, so losses remain limited while you give the trade room to play out.
Trading chart patterns demands patience and discipline. Rushing or ignoring key confirmations often leads to costly mistakes. Nigerian traders who take time to verify breakouts and respect timing signals increase their chances of profitable trades.
Adopting these tips—volume confirmation, market context awareness, careful timing, and proper risk management—can elevate your chart pattern trading skills in Nigerian markets. The focus should always be on trading smart, not just trading fast.
📈 Learn to spot 7 key chart patterns like head & shoulders, triangles, and flags. Boost your trading skills with practical tips for smarter market moves.

🔢 Explore the basics of binary accounts, their role in finance & tech, security tips, and Nigerian regulations in this detailed guide. 💼🔒

💸 Learn the ins and outs of withdrawal processing, from methods and timelines to handling challenges. A clear guide for smooth, transparent fund transfers.

📊 Explore the Big Book of Chart Patterns: learn key patterns 📈, tips for safe free PDF downloads 📥, legal advice 📜 & how to apply them in trading successfully.
Based on 12 reviews