
Using Finviz for Forex Trading Insights
Discover how Finviz can aid forex trading with visual tools, key forex data, and tips to combine it with other resources for smarter decisions 📊💱
Edited By
Olivia Morgan
Finviz is a well-known financial platform popular among forex traders, investors, and analysts for its neat presentation of market data. Among its many features, Finviz displays currency strength—an indicator showing how strong or weak a currency is relative to others in the market. This indicator is crucial for traders seeking to make quick decisions in the volatile forex market.
Currency strength on Finviz is usually depicted through a heatmap or numerical values, giving an immediate snapshot of a currency’s current performance. It is calculated by comparing the currency’s value against a basket of other currencies, often weighted by trade volume or market influence. For example, if the US dollar (USD) shows strong performance against the euro (EUR), pound sterling (GBP), and Japanese yen (JPY) on Finviz, it suggests USD is appreciating broadly.
Understanding currency strength helps traders identify trending moves and possible reversals without diving into countless individual currency pairs.
Knowing this, you can use Finviz’s currency strength data to:
Spot which currencies are gaining or losing momentum
Avoid currency pairs where strength difference is minimal, reducing risky choppy trades
Confirm trades by aligning currency strength with technical indicators
Yet, Finviz’s currency strength indicator is not without limits. It provides a snapshot based on current or recent prices, not accounting fully for upcoming economic news or unexpected shocks. In the Nigerian context, where forex prices can be affected by factors like naira volatility, official CBN policies, and informal market pressures, traders should combine Finviz data with local market knowledge.
Alternatives and complements exist, such as dedicated forex platforms like TradingView or MetaTrader, which offer more detailed currency strength analytics and customisation. Using these tools alongside Finviz can give Nigerian traders a sharper edge.
In summary, Finviz’s currency strength display is a valuable entry point for understanding overall currency trends. While it shouldn’t be used alone, it provides a practical, user-friendly way to read market momentum effectively, especially when combined with other tools and local insights.
Currency strength refers to how well a currency performs compared to others in the forex market. It is a snapshot of a currency's buying power, often measured against a basket of other currencies. For instance, when the Nigerian naira weakens against the US dollar and euro, its currency strength diminishes. Traders use this concept to gauge which currencies are gaining or losing value in real time, helping them identify potential opportunities.
Traders rely on currency strength indicators to simplify complex market movements into clear signals. Instead of analysing multiple forex pairs separately, they assess overall strength or weakness to detect trends faster. For example, if the British pound consistently shows strength while the South African rand weakens, a trader might decide to buy GBP/ZAR pairs. Monitoring currency strength helps traders avoid going against market momentum and improve timing for entries and exits.
Understanding overall currency strength can save you from betting on a weak horse. It highlights broad trends that individual pair analysis may miss.
Currency strength influences which forex pairs a trader chooses and the timing of trades. Knowing which currencies are strong or weak helps spot high-probability setups. For instance, if the US dollar shows strong momentum while the euro is weakening, executing a USD/EUR trade might offer better potential. Traders also manage risk better by avoiding pairs with uncertain strength or when both currencies show similar strength, leading to sideways movements. This clarity can be especially useful for short-term strategies like scalping or day trading.
In Nigeria, where naira volatility and global economic events impact forex markets heavily, currency strength insights from platforms like Finviz can guide both novice and experienced traders. Using currency strength as a baseline, traders can complement other tools like economic calendars or technical indicators to make smart decisions.
In summary, currency strength distils the forex market’s complexity into understandable signals. It highlights which currencies lead or lag, helping traders to make informed, timely, and strategic choices in a volatile trading environment.
Finviz serves as a practical financial analysis tool that aggregates diverse market data into a concise, user-friendly dashboard. For traders and investors dealing with forex, understanding how to navigate Finviz's currency strength features can enhance decision-making, offering quick snapshots of relative currency performance. Instead of hopping across multiple sources, Finviz bundles relevant information that helps identify which currencies are strengthening or weakening, a crucial step before entering trades.
Finviz is more than a simple charting platform — it compiles stock, forex, commodities, and futures data in one place. The site’s reputation comes from its clear layout and the visual tools that allow traders to scan markets efficiently. While it’s popular among Nigerian investors for equities on the Nigerian Stock Exchange (NGX), its forex components have gained traction since they deliver real-time insights into major global currencies. This capability can be especially useful during Nigeria’s ember months, when market volatility often increases.
When you visit Finviz’s forex section, you’ll notice a currency heat map that visually ranks currencies by strength. This is usually available on the homepage under the currency tab or directly through the forex dashboard. The heat map displays each major currency (like USD, EUR, GBP, NGN) in coloured blocks indicating whether the currency is strong (usually green shades) or weak (red shades). For example, if the Nigerian naira (NGN) shows as deep red, it suggests pressure on the currency, which might hint at an opportunity to focus on USD/NGN pairs carefully.
Finviz simplifies complex forex data into heat maps and tables. The tool shows relative strength scores, which compare how one currency performs against others over short or medium time frames. This visual display helps traders quickly spot trends — such as a rising dollar against a falling euro. However, the platform does not always provide the raw calculation details behind these scores, so you should use them alongside other data, like economic indicators or CBN policy announcements.
Navigating Finviz well allows you to save time on research and quickly spot forex market movements that matter, especially in fast-changing conditions like Nigeria’s current economic climate.
In sum, understanding where to locate currency strength info and how Finviz sketches this data equips Nigerian traders with a practical resource. By combining this with local market knowledge and other indicators, you improve your chances of making profitable trades with reduced guesswork.
Understanding how Finviz computes and presents currency strength is essential to make informed decisions in forex trading. This section unpacks the metrics behind the numbers, how to read Finviz's charts, and the limits traders should keep in mind when relying on its data.
Finviz derives currency strength using a combination of price performance, relative strength indices (RSI), and momentum indicators over multiple time frames. The platform aggregates these data points to rank currencies against a basket of others, providing a snapshot of which currencies are gaining or losing ground. For example, the US dollar (USD) might show strong momentum against the Euro (EUR) but weaker performance versus the Japanese Yen (JPY). The RSI helps spot overbought or oversold conditions, informing traders of potential reversals or continuation trends. This mix of metrics offers a practical way to identify underlying strength, beyond just price movements.
Finviz presents these findings visually through currency heat maps, where colours signal strength levels—usually green for strong and red for weak currencies. These heat maps cluster currencies in an easy-to-read format, showing which ones lead or lag across global markets. Traders can use this visual to quickly match strong currencies with weak ones, forming pairs with high profit potential. Alongside heat maps, relative strength scores give numerical ratings, allowing you to compare more specifically. For instance, a score of 85 for the British Pound (GBP) versus 40 for the South African Rand (ZAR) suggests a solid GBP-ZAR pair trade. Such displays help traders cut through noise when market volatility picks up.
While Finviz provides valuable insight, it's crucial to understand its data isn't foolproof. The platform pulls from forex rates and market data that can lag slightly, especially during volatile periods in the Nigerian market or globally. Additionally, Finviz focuses primarily on technical indicators without factoring in local events like Central Bank of Nigeria (CBN) policy shifts or political changes that directly impact naira strength. This can lead to gaps where what the charts show doesn’t align with ground realities, like fuel scarcity or economic data releases. Lastly, Finviz’s currency heat maps offer a static snapshot rather than predictive analytics, so relying solely on them can be risky without additional fundamental analysis.
In sum, Finviz’s currency strength tools offer a valuable baseline for identifying trends, but inexperienced traders should combine these insights with broader market knowledge and other indicators for better results.
By grasping how Finviz calculates and displays currency strength, traders can better navigate forex market swings and spot opportunities that align with their strategy. Keep these factors in mind to avoid pitfalls and use the platform with a balanced, informed approach.
Using currency strength data from Finviz equips traders with a quick snapshot of how different currencies are performing against others. It helps simplify the complex web of forex movements and guides traders in deciding which currency pairs to focus on. For Nigerian traders navigating volatile markets and fluctuating naira values, this tool can add a useful layer of clarity.
To build smart forex positions, you first need to pick currencies showing clear strength or weakness. On Finviz, strong currencies might consistently appreciate across multiple pairs, signalling a bullish trend, while weak currencies tend to lose ground. For example, if the US dollar (USD) shows broad strength on Finviz relative to other majors, pairing it with a weak currency like the South African rand (ZAR) may offer a lucrative opportunity. Recognising such trends can help avoid choppy pairs where both currencies are range-bound or moving sideways.
This approach is practical for short-term trades, especially in the Nigerian context where pairs like USD/NGN or EUR/NGN react sharply to local economic indicators. However, pairing choices should consider liquidity and spreads; popular pairs like USD/NGN have better volume and tighter spreads compared to less traded ones.
Several trading strategies integrate currency strength insights effectively:
Trend following: When you notice a currency strengthening steadily, you can ride the trend by going long on pairs where this currency dominates.
Breakout plays: Sudden shifts in currency strength can signal breakouts. If Finviz shows sharp strengthening, an entry can be timed around news releases or economic data for bigger moves.
Currency hedging: Traders with exposure in weak currencies can hedge by taking positions in stronger ones, protecting portfolio value from adverse swings.
For instance, a Nigerian trader sensing naira weakness may hedge using strong currencies like USD or GBP, especially during ember months when FX shocks often occur. Finviz currency heat maps help spot these shifts in real time.
While currency strength from Finviz is a handy guide, placing full trust on it can be risky. The data reflects recent market movements but may not capture sudden geopolitical events, policy changes, or illiquid market segments.
Also, currency strength indicators don’t reveal why a currency is moving. For example, a naira drop might reflect both domestic inflation concerns and external oil price shocks. Using Finviz data in isolation, without considering broader economic reports or central bank signals from CBN, could lead to misleading conclusions.
Always combine currency strength with other tools like fundamental analysis, economic calendars, and local market news to form a more complete trading picture.
In summary, Finviz gives you an easy way to spot strongest and weakest currencies and supports strategies centred on momentum or hedging. Just remember to back this up with local context, market news, and risk management to trade profitably in Nigerian forex markets.
While Finviz provides a solid starting point for currency strength analysis, Nigerian traders often need additional tools to capture the full picture in forex markets. Finviz’s data can sometimes lag behind or miss local nuances, especially in a volatile environment like Nigeria’s naira market. Exploring alternatives and supplementary methods helps traders reduce risks and pinpoint better entry and exit points.
Apart from Finviz, platforms like Investing.com, TradingView, and Myfxbook see wide usage among Nigerian forex traders. Investing.com offers a reliable currency strength meter with real-time updates beneficial during news events. TradingView stands out with its wide range of customised indicators and charting tools that allow traders to map currency strength alongside price action directly on the charts. Myfxbook provides analytic tools including correlation matrices, which help traders understand how certain currencies move in relation to others.
Local fintech apps such as OPay and PalmPay occasionally integrate market data, providing accessible insights right on mobile phones. This convenience lets busy traders track currency dynamics even during Lagos traffic jams or power outages. Some professional Nigerian brokers also provide proprietary tools or plugins, offering another layer of analysis tailored to local market conditions.
Relying on a single currency strength indicator can leave you vulnerable to false signals. Combining Finviz’s currency heat maps with volatility indicators like the Average True Range (ATR) or momentum oscillators such as the Relative Strength Index (RSI) improves decision-making. For instance, a currency may show strength on Finviz, but a falling RSI or contracting ATR can signal a weakening trend.
Correlation tools can further verify trades by highlighting whether strong currencies pair well with weak ones based on historical data. Nigerian traders benefit from supplementing global data with news feeds on CBN policies, fuel prices, or political developments, which all affect currency moves but may not register immediately in charts.
The key is to use a layered approach: start with a strength indicator, then validate with price action and market context to avoid chasing misleading trends.
Global indicators don't fully capture the peculiarities influencing the naira or regional currencies. Factors such as CBN’s foreign exchange interventions, electricity supply challenges leading to increased generator petrol consumption, and informal sector currency demand heavily sway currency strength locally.
Ember months, for example, usually see heightened demand for currency due to festive spending, affecting naira volatility. Meanwhile, events like fuel subsidy removals or political tensions can cause sudden liquidity crunches and rapid currency swings not instantly reflected on global platforms like Finviz.
Furthermore, external factors like oil price fluctuations also trickle down to Nigerian forex markets strongly due to the economy’s oil dependence. Successful traders keep a close eye on both these local realities and international trends to navigate the currency landscape effectively.
In summary, while Finviz is useful, Nigerian forex traders gain an edge by tapping into diverse tools, combining multiple technical indicators, and continuously monitoring local economic and political developments. This multi-pronged approach leads to sharper analysis and more robust forex trading strategies.
Discover how Finviz can aid forex trading with visual tools, key forex data, and tips to combine it with other resources for smarter decisions 📊💱
Find the best forex trading app for Nigerian traders 🇳🇬. Get tips on safe trading, local features, and how to make gains in the forex market with ₦. Stay smart, trade easy!
Discover key benefits of forex trading for Nigerian investors🇳🇬: market access, liquidity, profit chances, and smart portfolio diversification!💹
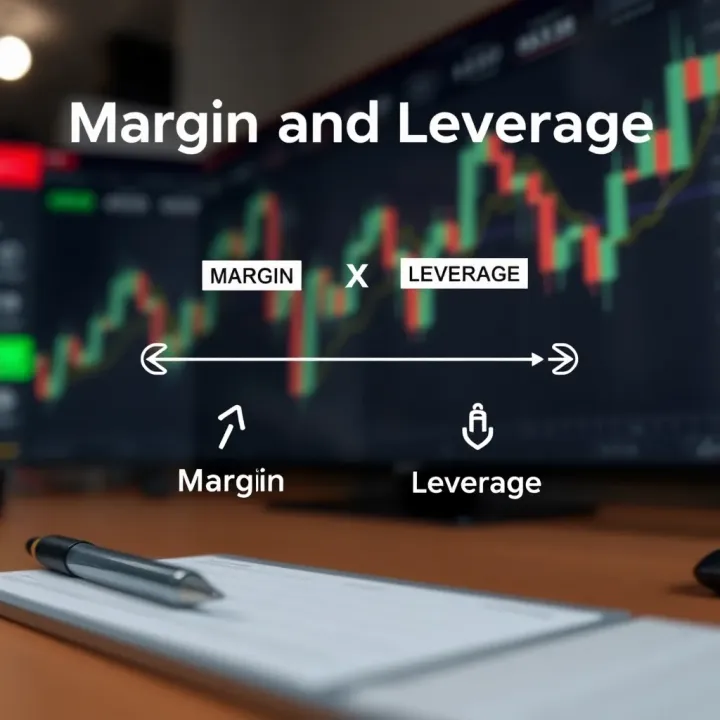
📊 Discover how margin works in forex trading, understand leverage and risk management to make smarter trading decisions. Stay informed and in control!
Based on 8 reviews