

Understanding Derivative Trading for Nigerian Investors
Explore derivative trading in Nigeria 📈 Learn how to manage risk, diversify portfolios, and navigate the market with practical tips for Nigerian investors. ₦
Edited By
Isabella Walker
Trading charts are indispensable tools for anyone serious about investing or trading in Nigeria’s financial markets. Whether you’re dealing with stocks listed on the Nigerian Exchange Group (NGX), forex, or commodities, charts provide visual insights into price movements and market trends over time. Without a good grasp of chart reading, it’s like trying to navigate Lagos traffic with no directions — you’re likely to get stuck or take the wrong turn.
Unlike blindly following tips or news headlines, charts show what the market is actually doing, helping you make decisions based on real data. For Nigerian investors navigating the volatility of the naira and fluctuating market conditions influenced by local economic factors, charts become even more vital.
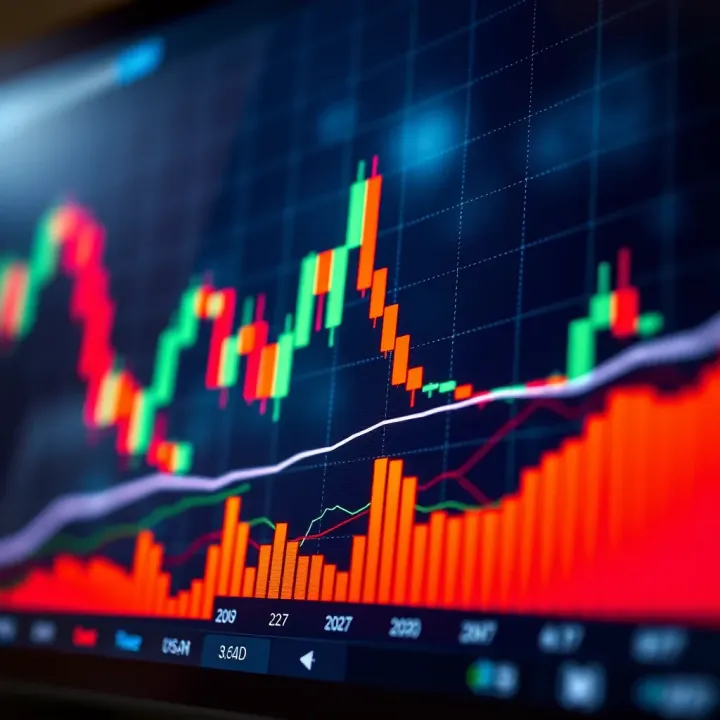
Mastering trading charts allows you to spot patterns, anticipate price changes, and know when to enter or exit investments — skills that can protect your ₦ and maximise returns.
Understand Price Action: Charts break down prices over different timeframes—from minutes to months—so you can track short-term spikes or long-term trends.
Identify Patterns: Recognising formations like head and shoulders, double tops, or triangles can signal potential reversals or continuations unique to Nigerian stocks or sectors.
Use Technical Indicators: Tools like moving averages and RSI (Relative Strength Index) help understand momentum and overbought/oversold conditions, which guide timely trades.
Adapt to Volatility: With naira fluctuations and external shocks affecting markets, charts assist in reacting to fast market changes before news spreads widely.
Consider a trader watching shares of MTN Nigeria. By observing a candlestick chart over the past three months, they might notice a series of higher lows and higher highs—a bullish trend suggesting growing investor confidence. Layering this with a 50-day moving average can confirm the price’s upward momentum, signalling a good time to buy.
In contrast, if they spot a double top pattern around a resistance level, it could warn of a coming price drop, prompting the trader to secure profits or set stop-loss orders.
Understanding these basic elements of trading charts equips Nigerian investors with a sharper edge in the market. Next, we’ll explore the main types of charts and how you can read them effectively.
Trading charts are a core tool for any serious investor or trader, especially in Nigeria’s dynamic market. They allow you to visualise price movements over time, offering insights that mere numbers on a screen can’t convey. In this section, we’ll break down what trading charts are and why Nigerian traders should pay close attention to them.
Trading charts are graphical representations of an asset’s price action across different periods. Think of them as the storybook of the market, where each plot point or bar tells you what happened to a stock or currency price over a specific timeframe. These charts can range from simple line charts that connect closing prices, to more complex candlestick charts showing open, high, low, and close prices. For example, if you’re tracking the shares of a blue-chip Nigerian company listed on the Nigerian Stock Exchange (NSE), a candlestick chart can show you daily price swings, helping you understand market sentiment in real time.
Moreover, these charts are not just for stocks. Nigerian investors dealing in forex or cryptocurrencies can equally benefit by monitoring charts provided on platforms like Binomo, MTN’s mobile money markets, or local crypto exchanges. By interpreting these charts correctly, you spot entry and exit points more confidently.
Charts help Nigerian traders cut through the noise of the market. The Nigerian economy's volatility, driven by factors such as oil price swings, forex scarcity, and policy changes from the Central Bank of Nigeria (CBN), means prices can shift rapidly. Without a chart, it’s like trying to navigate Lagos traffic blindfolded.
Using charts, traders identify trends—whether prices are generally rising or falling—which informs better decision-making. For instance, during periods of fuel scarcity, some transport shares might show unusual price spikes on charts before the news is widespread. Sharp traders spot such signals early, potentially profiting before others catch up.
Charts also show support and resistance levels—price points where an asset tends to stop its movement and reverse direction. For a Nigerian investor, recognising these levels can prevent heavy losses or missed gains. It’s very much like understanding when the danfo driver slows down or speeds up based on traffic patterns.
Successful trading without charts is like walking into a room with the lights off; you might find your way but it’s risky and inefficient.
Understanding different types of trading charts is essential for Nigerian investors seeking to navigate the financial markets confidently. Each chart type presents price data in a unique way, helping traders spot trends, reversals, and potential entry or exit points. Choosing the right chart depends on your trading style and the asset class, whether stocks on the Nigerian Stock Exchange (NGX), forex, or cryptocurrencies.
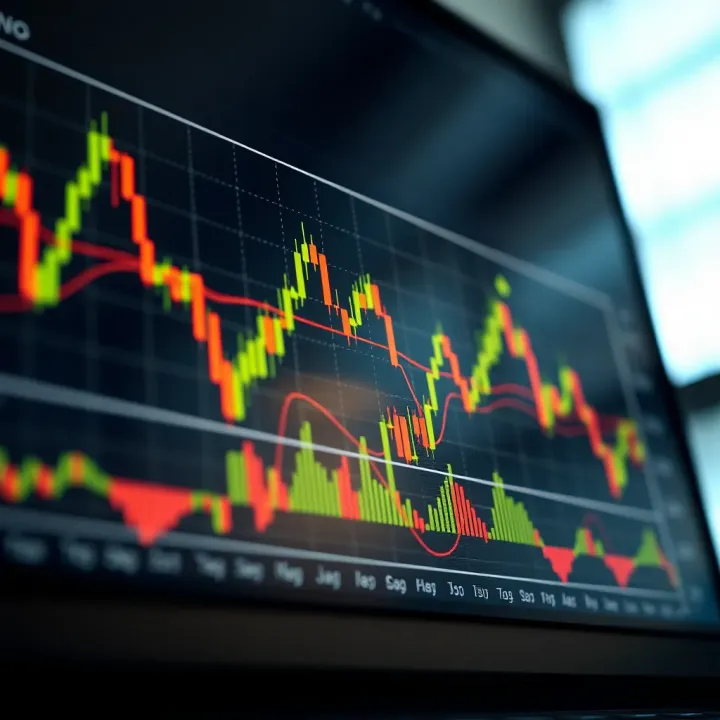
Line charts offer a straightforward way to observe price movements over time. They connect closing prices with a solid line, showing a clear picture of the general direction without distractions from daily ups and downs. For beginners on the Nigerian market, line charts help easily grasp market trends, especially when tracking instruments like NGX stocks or government bonds. However, while simple, line charts miss intraday price details, limiting their use in active trading.
Bar charts provide more detailed insight by displaying opening, high, low, and closing prices (OHLC) for each trading period. This allows investors to understand volatility and price range within a day or session. For instance, if a Nigerian trader follows shares like Dangote Cement or MTN Nigeria, bar charts reveal how far price fluctuated in sessions impacted by economic reports or sector news. Bar charts, although slightly more complex, suit traders who want depth in price action without the overwhelming detail of other charts.
Candlestick charts combine the clarity of bar charts with visual ease, making them the preferred choice among many Nigerian traders. Each candlestick shows the OHLC prices, but with coloured bodies indicating bullish or bearish moves, the chart quickly signals market momentum shifts. For example, during ember months when market volatility tends to rise, candlestick patterns like the hammer or engulfing candles can alert traders to potential reversals in stocks or currencies. This visual appeal helps investors respond swiftly, making candlestick charts ideal for both short-term and medium-term strategies.
Choosing the right chart type is not just about preference; it influences your market reading and trading decisions. Nigerian investors should experiment with these chart types on platforms like Bamboo or Trove to find what aligns best with their objectives and the local market dynamics.
Knowing how to interpret these charts builds a solid foundation for reading technical indicators and patterns, which this article will explore further. With a clear grasp of line, bar, and candlestick charts, Nigerian investors are better placed to make informed decisions amid the country’s unique market landscape.
Chart patterns give Nigerian investors a visual guide to understand market behaviour. These patterns help predict future price movements by highlighting investor sentiment at specific points. Mastering key chart patterns is essential because it guides when to buy, hold, or sell, helping avoid costly mistakes especially amid the often volatile Nigerian markets.
Trend patterns show the general direction of price movement over a period. An uptrend means prices are generally rising, marked by higher highs and higher lows. This signals buying opportunities for investors wanting to capitalise on growing values, such as when shares of Dangote Cement steadily advance during strong economic periods.
On the other hand, a downtrend features lower highs and lower lows, indicating falling prices. This usually warns investors to be cautious or to exit positions — like what happened to some banking stocks during the 2020 pandemic slump. Recognising these trends early helps traders align their strategies accordingly and avoid chasing losses.
Reversal patterns indicate a probable change in the trend direction. These patterns warn investors that a prevailing uptrend or downtrend may soon end. For instance, a “double top” pattern—where the price hits a resistance level twice before falling—is a signal the stock may start declining. This could be seen in shares like MTN Nigeria when profit-taking sets in after prolonged growth.
Conversely, the “double bottom” pattern suggests a downtrend is losing steam and a rise may follow. These reversal signals are particularly useful for traders who want to catch market turns before they become obvious to general investors.
Continuation patterns suggest the current trend will likely continue after a brief pause or consolidation. Examples include “flags” and “pennants,” which look like small, short-term sideways movements on the chart before the price resumes its trend.
For traders on the Nigerian Exchange (NGX), spotting these patterns can confirm ongoing momentum. For example, during periods of local economic growth, oil companies like Seplat Energy show consolidation before surging higher, helping investors hold their positions with confidence.
Recognising these chart patterns enhances decision-making. Whether you’re watching equities, forex pairs like USD/NGN, or crypto assets, understanding trends, reversals, and continuation signals positions you better to respond to market moves.
In summary, key chart patterns provide an essential toolkit for Nigerian investors. They shape practical strategies by identifying when trends are strong, when they falter, and when they will likely push on. Master these, and you'll navigate the Nigerian markets with sharper insight and less guesswork.
Technical indicators add depth to trading charts by turning raw price data into actionable insights. For Nigerian investors, combining charts with these indicators improves the accuracy of market analysis and decision-making. Instead of guessing price direction, traders can use indicators to confirm trends, spot momentum shifts, or identify overbought and oversold conditions. This layered information helps minimise risks, especially in Nigeria’s sometimes volatile market.
Moving averages are essential for filtering out market noise. They calculate the average price over a set period to highlight the overall trend. For example, the 50-day moving average gives a sense of mid-term price direction, while the 200-day average shows long-term trends. If the stock price crosses above its 50-day moving average, it might signal a bullish phase. Nigerian investors often watch for these crossovers as entry or exit points, particularly on the Nigerian Stock Exchange (NGX).
Moving averages also help quell sudden price spikes caused by speculation or local economic news. For instance, during periods of fuel subsidy debates or political uncertainty, price swings can mislead inexperienced traders. A moving average smooths such bumps to offer a clearer market picture.
The Relative Strength Index (RSI) measures price momentum to indicate when an asset may be overbought or oversold. It ranges from 0 to 100, with readings above 70 suggesting overbought (potential price drop ahead) and below 30 indicating oversold conditions (possible price rebound). Nigerian traders use RSI to time buy or sell decisions.
For example, if the Nigerian naira-dollar currency pair shows an RSI below 30, it might hint at a buying opportunity before the naira strengthens. Likewise, RSA-listed stocks reaching RSI above 70 could be due for correction, signalling caution for investors.
Volume analysis examines the number of shares or contracts traded over a period. High volume during upward price moves confirms strong buying interest, while low volume might suggest a weak trend. This is crucial on the NGX where liquidity varies across stocks.
Imagine Diamond Bank (now Access Bank) experiences a sudden price increase. If accompanied by high volume, it suggests genuine investor demand. But if volume is low, price rise might be due to few players and could reverse sharply. Nigerian traders must check volume to avoid jumping on false breakouts, especially amid ember months when market activity fluctuates.
Combining price charts with these technical indicators sharpens your market lens. Moving averages smooth noisy data, RSI highlights momentum extremes, and volume confirms if price moves are backed by real participation. They aid Nigerian investors in making informed, confident trades.
Using technical indicators alongside trading charts bridges the gap between guesswork and clear analysis. Incorporate these tools to stay ahead in Nigeria’s dynamic market.
Trading charts are not just tools for following patterns; they are indispensable for Nigerian investors navigating a uniquely volatile and dynamic market. Understanding how to apply charts in the Nigerian context helps investors make more informed decisions, reduce risk, and capitalise on short- and medium-term opportunities.
The Nigerian Stock Exchange (NGX) is known for its price swings influenced by both global and local events. Trading charts provide essential visuals that help investors track price movements, spot trends, and time their trades. For example, during periods when sectors like banking or oil & gas show strong momentum, a chart can confirm these trends through consistent upward movements, signalling potential buy points.
Charts also help investors identify resistance and support levels unique to Nigerian equities. A stock like Dangote Cement may frequently test specific price points before breaking out or pulling back. Recognising these levels on a candlestick or bar chart can provide traders with entry or exit signals, preventing emotional decisions amid market rumours or naira fluctuations.
Nigeria’s economic realities — including fuel subsidy adjustments, power supply challenges, and foreign exchange restrictions — impact market volatility sharply. Traders using charts must factor in these conditions by watching volume spikes or unusual price gaps.
For instance, during ember months when consumer spending rises and inflation pressures intensify, charts often show increased volatility marked by erratic price swings. An investor mindful of these conditions uses chart indicators like moving averages combined with volume to verify whether price movements are sustainable or just noise triggered by temporary economic shocks.
Additionally, political events such as guber elections in major states cause periodic unrest or optimism, and these reflect clearly on trading charts. Nigerians traders who pay attention to how charts behave before, during, and after such events gain advantages in positioning themselves effectively.
Forex and cryptocurrencies are fast-growing investment classes for Nigerians, especially given the naira’s volatility. Trading charts here help spot entry and exit points in volatile environments where prices can swing wildly within minutes.
In forex, charts for pairs like USD/NGN or GBP/NGN show real-time trend shifts triggered by CBN monetary policies or external shocks. For instance, when the Central Bank of Nigeria announces a rate change or intervenes in the FX market, charts often show immediate reactions through volume surges or sharp candlestick formations.
As for cryptocurrencies, platforms like Binance and Luno provide comprehensive charting tools for Nigerian investors to monitor coins like Bitcoin and Ethereum. Given the 24-hour trading cycle and global influences, candles on these charts react quickly to news — regulators’ statements or fintech developments in Nigeria. A chart-literate trader can then decide when to secure profits or cut losses amid speculative trades.
Trading charts, when applied with local market knowledge and a keen eye on economic events, offer Nigerian investors a better chance to navigate complexities and enhance profitability.
In summary, applying trading charts in Nigeria means more than reading graphs. It demands understanding local market rhythms, economic triggers, and sectoral patterns to make smarter investments on the NGX, forex, and crypto markets. Practically, charts empower Nigerians to avoid guesswork and base trades on data reflective of actual market behaviour influenced by homegrown realities.
Explore derivative trading in Nigeria 📈 Learn how to manage risk, diversify portfolios, and navigate the market with practical tips for Nigerian investors. ₦

📈 Discover how Nigerian investors can use copytrading to follow experts, understand the risks and benefits, and start smart investing today. 🇳🇬💼
Explore how Nigerians can trade indexes like NGX35 and global ones to diversify portfolios with ease 📈. Learn benefits, risks, and top platforms to start investing today!
📈 Learn how demo trading helps Nigerian traders sharpen skills with virtual money, avoid common traps, and gain real confidence amidst naira's market shifts. 🇳🇬
Based on 5 reviews